Facts and figures

Explore the key facts and figures that reflect our performance and global reach.
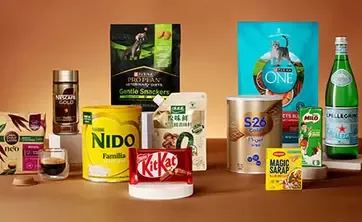
Our business
We apply our expertise to help people and pets live happier, healthier lives. The categories reported reflect our 2025 Annual Report. In 2026, we announced an update to our operating segments.
What we sell
Powdered and
Liquid Beverages
28.1%
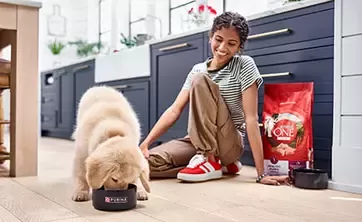
PetCare
20.6%
Nutrition and
Health Science
16.0%
Prepared dishes
and cooking aids
11.3%
Milk products
and Ice cream
10.8%
Confectionery
9.7%
Water
3.5%
Where we sell
Zone Americas
48.0%
Zone Europe
25.2%
Zone Asia, Oceania and Africa
26.8%
Number of countries we sell in
185
Our financial performance
A summary of the 2025 full-year results is shown here. For full results, please consult the Financial review section.
Group sales (in CHF)
89.5
billion
Organic growth *
+
3.5
%
Real internal growth *
+
0.8
%
Underlying trading operating profit * (in CHF)
14.4
billion
Underlying trading operating profit margin *
16.1
%
Underlying trading operating profit margin *
-
100
basis point
Trading operating profit* (in CHF)
12.7
billion
Trading operating profit margin*
14.2
%
Trading operating profit margin *
-
170
basis point
Earnings per share (in CHF)
3.51
Earnings per share (in CHF)
-
16.3
%
Underlying earnings per share *
-
1.8
%
Operating cash flow (in CHF)
15.9
billion
Free cash flow * (in CHF)
9.2
billion
Proposed dividend (in CHF)
3.10
Proposed dividend increase
+
1.6
%
* Financial performance measures not defined by IFRS.
Our key non-financial performance
To measure our progress, we use a comprehensive set of indicators that support our business performance and generate value for our shareholders and other stakeholders. Some key performance indicators are included here – the full set is in our Non-Financial Statement (pdf, 16Mb).
Climate
We aimed to reduce our greenhouse gas (GHG) emissions by 20% by 2025 and we aim to further reduce such emissions by 50% by 2030, on the road to net zero by 2050 at the latest.
*Covers emissions related to our net zero targets. Net reductions (%) include removals from inside Nestlé’s value chains and sourcing landscapes.
Our KPI
24.5
%
Nature
By 2025, we aimed to achieve and maintain 100% assessed deforestation-free primary supply chains (for meat, palm oil, pulp and paper, soy, sugar, cocoa and coffee).
Our KPI
96.7
%
Regenerative Agriculture
By 2025, we aimed for 20% of volumes of key ingredients to be sourced from farmers adopting regenerative agriculture practices.
Our KPI
27.6
%
Packaging
By 2025, we aimed to reduce virgin plastics by one third versus our 2018 baseline.
Our KPI
28.0
%
Diversity, equity and inclusion
Our KPI
48.2
%
Health and nutrition
Our KPI
135.4
billion
To measure our progress, we use a comprehensive set of indicators that support our business performance and generate value for our shareholders and other stakeholders.
Non-financial performance metrics are defined in the 2025 Reporting Scope and Methodology for ESG Key Performance Indicators (KPIs) - Appendix 1 in the Non-Financial Statement (pdf, 16Mb).
EY has performed limited assurance on the six key performance indicators on this page. The assurance statement with EY ’s independent conclusion can be found in the Non-Financial Statement (pdf, 16Mb).
Explore more of our Annual Report


Downloads
Nestlé's Annual Report includes our Annual Review, Corporate Governance Report, Compensation Report, Financial Statements and Non-Financial Statement.